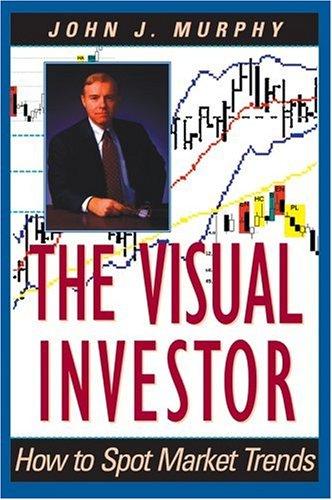
The visual investor
The Visual Investor, Second Edition breaks down technical analysis into terms that are accessible to even individual investors. Aimed at the typical investor--such as the average CNBC viewer--this book shows investors how to follow the ups and downs of stock prices by visually comparing the charts, without using formulas or having a necessarily advanced understanding of technical analysis math and jargon. Murphy covers all the fundamentals, from chart types and market indicators to sector analysis and global investing, providing examples and easy-to-read charts so that any reader can become a skilled visual investor.
Keep track of this book with your own statuses, rating and reading queue.
Sign in Registration opens with the beta.
Subjects
- nonfiction
- Business
- finance
- stocks
- investment analysis
- stock exchanges
- charts, diagrams
- portfolio management
2 more
- investeringen
- beleggingsfondsen
Similar books
- Technical Analysis of the Financial Markets
- Study Guide to Technical Analysis of the Financial Markets (New York Institute of Finance)
- What works on Wall Street
- Expectations Investing
- The neatest little guide to stock market investing
- Inside the black box
- Standard & Poor's how charts can help you in the stock market
- The Candlestick Course